Key Metrics
Key Metrics
|
Financial Highlights (in AED mn)
|
FY-2021
|
FY-2022
|
FY-2023
|
FY-2024
|
|---|---|---|---|---|
|
Consolidated income statement
|
|
|
|
|
|
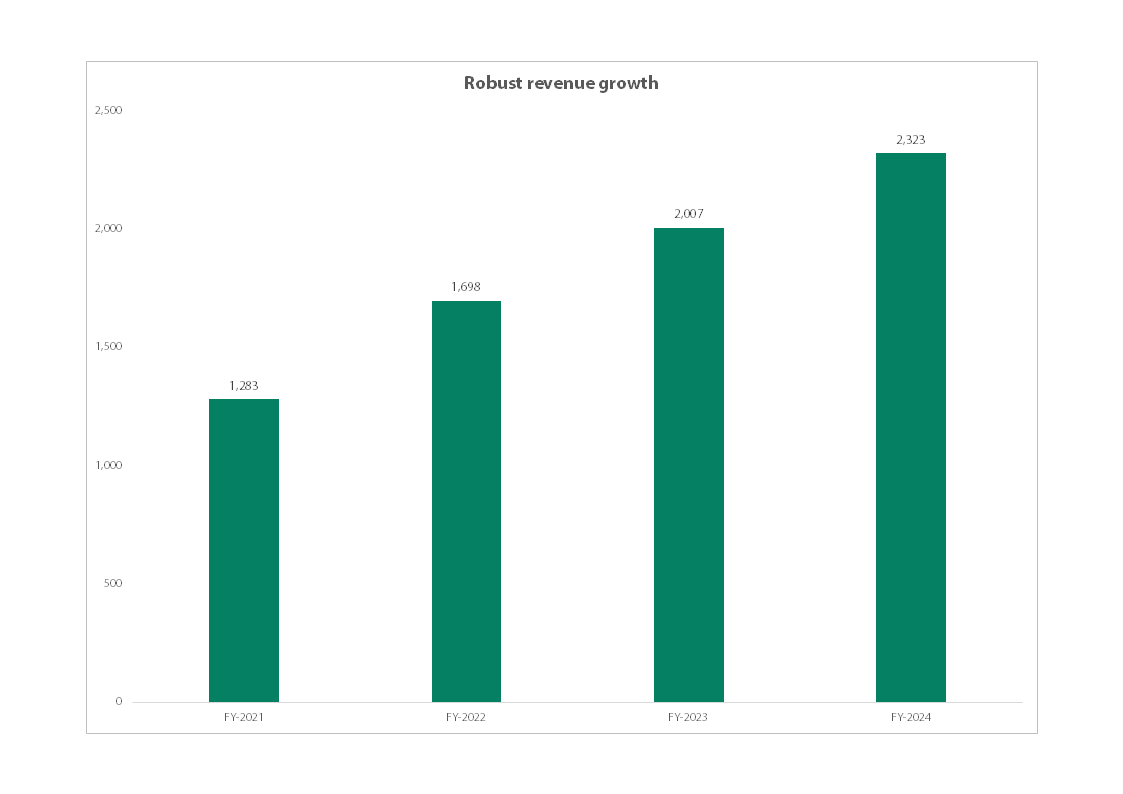
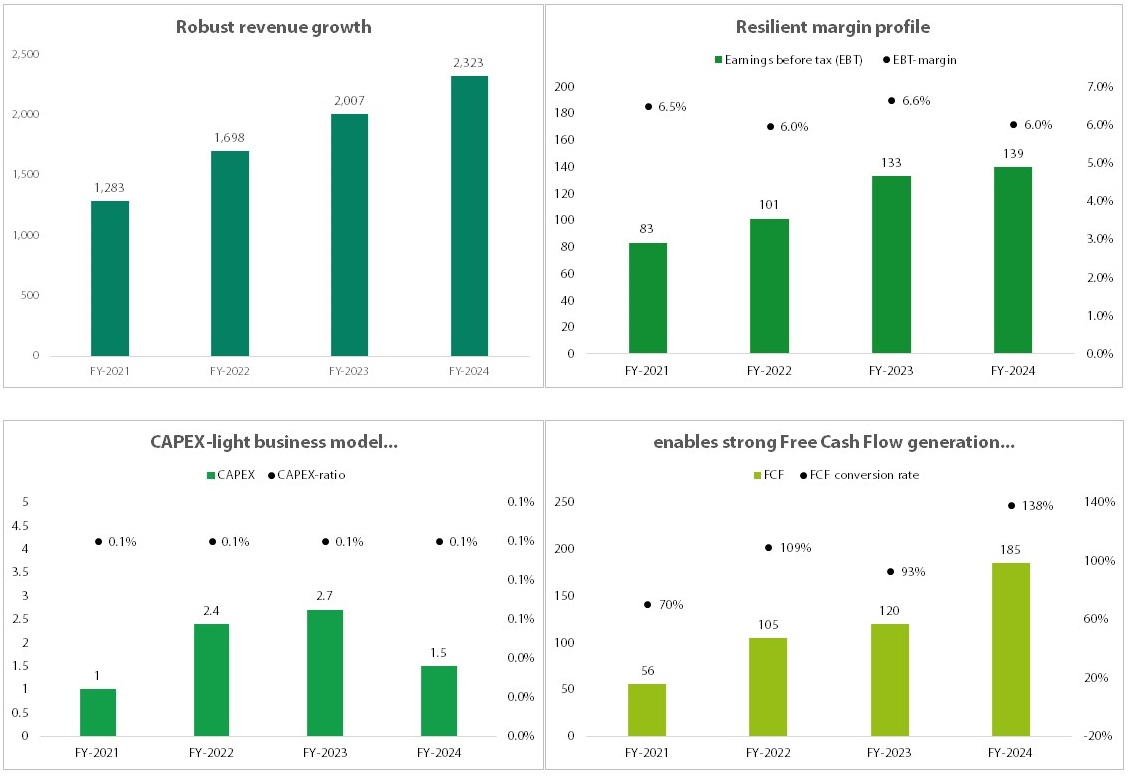
Revenue
|
1,283
|
1,698
|
2,007
|
2,323
|
|
Gross Margin
|
13.8%
|
12.3%
|
13.4%
|
12.5%
|
|
Earnings before tax (EBT)
|
83
|
101
|
133
|
139
|
|
EBT-margin
|
6.5%
|
6.0%
|
6.6%
|
6.0%
|
|
Other Key Indicators
|
|
|
|
|
|
Capital Expenditure (CAPEX)
|
1
|
2.4
|
2.7
|
1.5
|
|
CAPEX-ratio
|
0.1%
|
0.1%
|
0.1%
|
0.1%
|
|
FCF
|
56
|
105
|
120
|
185
|
|
FCF conversion rate
|
70%
|
109%
|
93%
|
138%
|
|
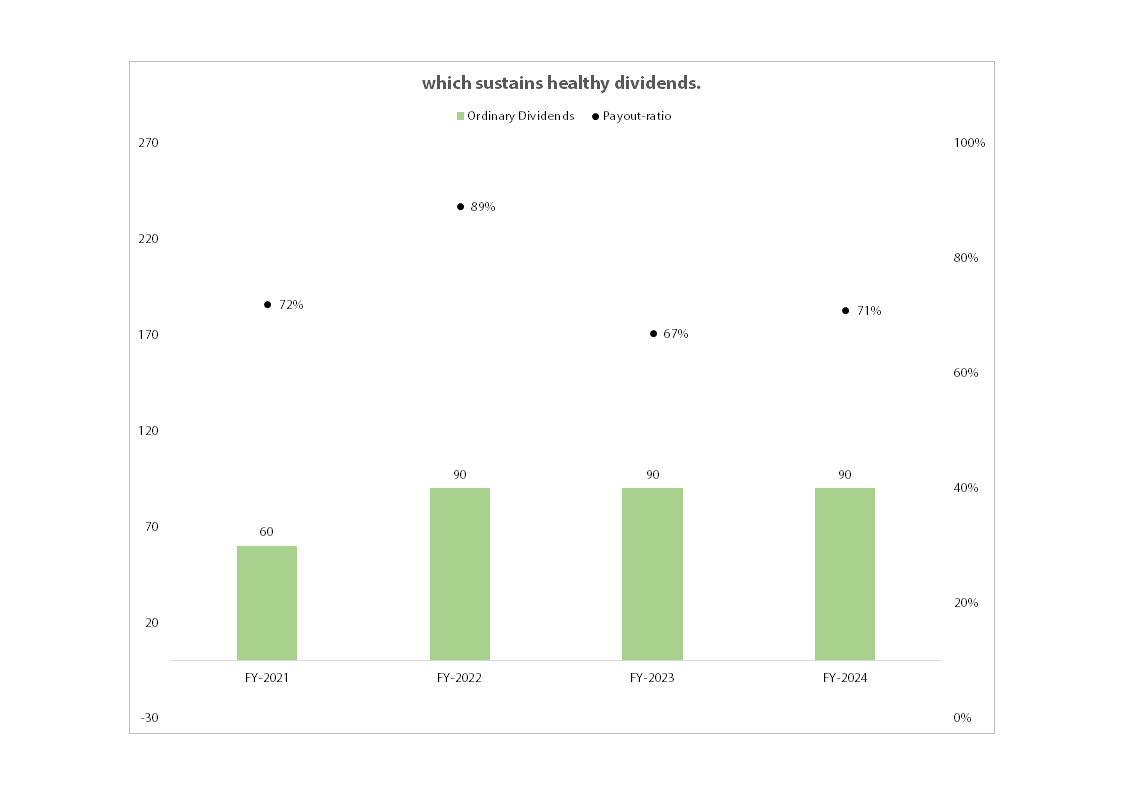
Ordinary dividends
|
60
|
90
|
90
|
90
|
|
Payout-ratio
|
72%
|
89%
|
67%
|
71%
|
Key Metrics
|
Financial Highlights (in AED mn)
|
FY-2021
|
FY-2022
|
FY-2023
|
FY-2024
|
FY-2025
|
|---|---|---|---|---|---|
|
Consolidated income statement
|
|
|
|
|
|
|
Revenue
|
1,283
|
1,698
|
2,007
|
2,323
|
2,487
|
|
Gross Margin
|
13.8%
|
12.3%
|
13.4%
|
12.5%
|
13.8%
|
|
Earnings before tax (EBT)
|
83
|
101
|
133
|
139
|
158
|
|
EBT-margin
|
6.5%
|
6.0%
|
6.6%
|
6.0%
|
6.4%
|
|
Net Income
|
83
|
101
|
133
|
127
|
143
|
|
Other Key Indicators
|
|
|
|
|
|
|
Capital Expenditure (CAPEX)
|
1
|
2.4
|
2.7
|
1.5
|
4.7
|
|
CAPEX-ratio
|
0.1%
|
0.1%
|
0.1%
|
0.1%
|
0.2%
|
|
FCF
|
56
|
105
|
120
|
185
|
157
|
|
FCF conversion rate
|
70%
|
109%
|
93%
|
138%
|
109%
|
|
Ordinary dividends
|
60
|
90
|
90
|
90
|
130
|
|
Payout-ratio
|
72%
|
89%
|
67%
|
71%
|
91%
|
Graphs
Quick Links
© 2026 Alpha Data | All Rights Reserved